
Notes from the Fringes of Academia
Property Tax as a ‘Practical’ Wealth Tax
What can a wealth tax actually reach in practice? This question has been on a constant simmer for several decades now (Piketty, 2014; Saez, 2017), and over the last few years, it is again in the public discourse—from the streets of Paris (Alderman, 2025), to conversations about taxing second homes in New York (Walt, 2025), to one time levies in California (Boll et al., 2026), to the Norwegian elections (Garside, 2025), to the G20 presidencies of Brazil and South Africa (DIRCO, 2025; Partington, 2024; Stiglitz et al., 2025). One thread that emerges from all these instances is that defining the tax base is not easy, as capital is mobile, and financial assets can be restructured, relocated, or concealed.
The experience of OECD countries that did implement wealth taxes, is a case in point: tax bases were narrowed by exemptions, revenues fell short, and eventually the taxes were repealed (Hebous et al., 2024; Scheuer & Slemrod, 2020). Evidence also suggests that reported wealth responds strongly to notified rates, as in the case of Switzerland (Brülhart et al., 2016), and a sizeable share of the wealth at the very top of the distribution, sits offshore to begin with (Alstadsæter et al., 2018; Zucman, 2019).
There is, however, one asset that does none of those things. Real estate. A house cannot be moved to a lower-tax jurisdiction, can be located on the public register of where it is and how large it is, and placed on a valuation roll that records what it was last assessed at. Even where ownership is routed through a trust or a company, the asset itself stays visible and taxable (Norregaard, 2013).
It is also the asset that a wealth tax cannot miss. For most households housing is the largest thing they own (Causa et al., 2019; Davies et al., 2011). At the top of the distribution it is a smaller share of a much larger portfolio, but in absolute terms that is where the largest and most visible holdings sit, and it is the part that cannot be hidden. South Africa, where the richest tenth hold around 85 percent of household wealth, is a case in point (Chatterjee et al., 2022; Orthofer et al., 2019). A tax on assessed property value is therefore arguably among the more enforceable ways of taxing wealth. It is imperfect, falling on gross value with no deduction for debt, and on a single asset class, but it reaches that class quite reliably, which capital-based instruments have often struggled to do.
Whether it taxes wealth progressively depends on design. Property taxes in the United States are often regressive in effect, because housing is a smaller share of wealth the further up the wealth distribution, and assessments tend to track market values unevenly across neighbourhoods (Avenancio-León & Howard, 2022; Levinson, 2021). Progressivity has to be designed, through the rate schedule (i.e., the threshold below which nothing is due), and the accuracy of the valuation roll.
A property’s value has two sources, and the design problem sits between them. The structure, i.e., the dwelling and whatever the owner has invested in it, is produced by the owner. The location is produced by everyone else: by public investment in roads, transport, schools, and amenities, and by the presence and activity of other residents. The argument follows from Henry George (Brown, 1997; Wenzer, 2016), and it carries a normative asymmetry: the public claim on location value is strong, because the public produced it, while the claim on the structure is weaker, because it reflects private investment. Publicly produced location value does not stay public, however. It accrues to whoever owns the land when the city improves around it, and over time it accumulates as private wealth in the hands of households who did not create it. A property-wealth tax that is fair in these terms has to know how much of the value is location, and who is holding it (see Figure 1).
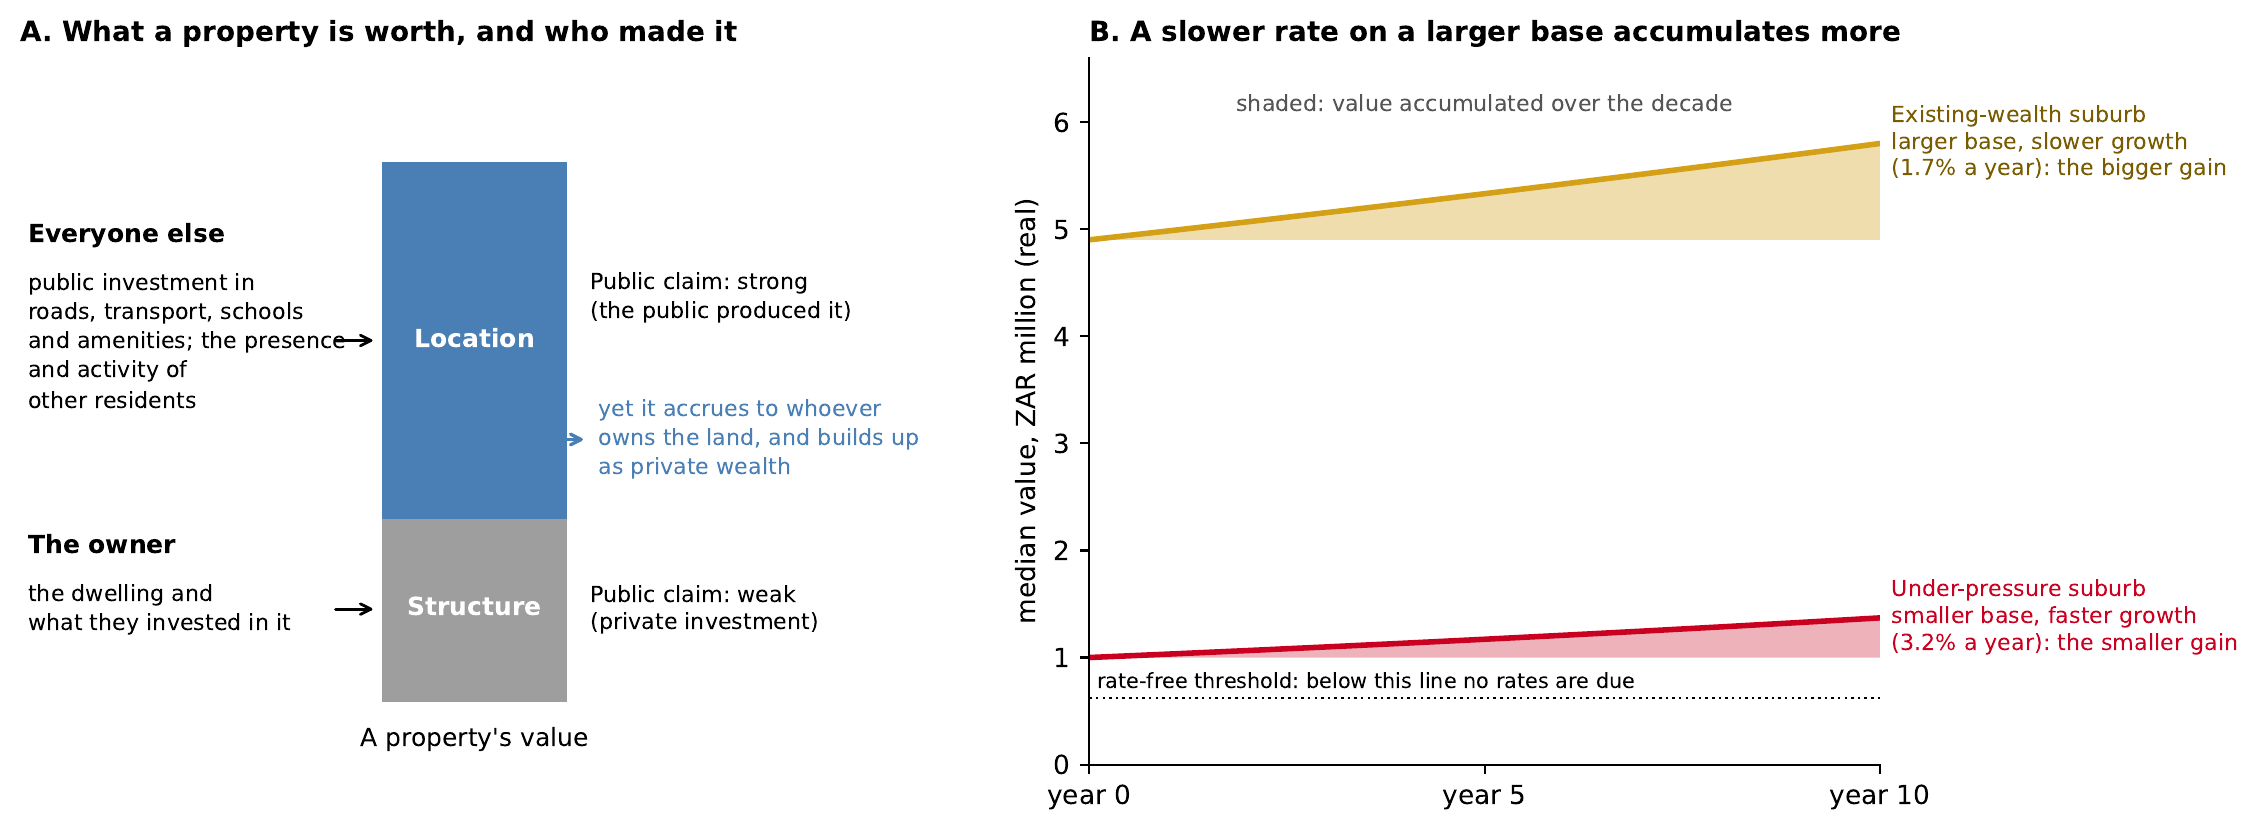
Figure 1 The two sources of a property’s value and who produced them (A), and why a slower rate on a larger base accumulates more (B). Panel B is illustrative, drawn with the mean 2022 values and appreciation rates of the two Cape Town lists in Table 1; the dotted line is the City’s rate-free threshold.
Cape Town as a test
How much of a city’s property value is location, and who holds it? Cape Town offers a test of whether either can be answered from data a city already has. In recent work (Jana, 2026), we used the City’s valuation rolls, which give the median residential value of each of its roughly 700 suburbs at four points between 2012 and 2022, and satellite layers of building footprint and population (Pesaresi, 2023).1
Dividing each suburb’s median value by its median dwelling size nets out the size of the house, so what remains—value per square metre—is essentially the price of the location. On raw value, inequality between suburbs appears to narrow over the observed decade, the Gini coefficient falling from 0.466 to 0.457. On value per square metre, however, it rose, from 0.231 to 0.242. Dwelling size reconciles the two: in the cheapest two-fifths of suburbs in 2012, it grew at about 1.6 percent a year, twice the pace elsewhere, so much of the value growth at the bottom came through larger dwellings rather than more expensive locations. The apparent assessment is that most of Cape Town’s real estate appreciation appears to be driven by location value produced by the surrounding city.
Who is holding this “wealth” is the second question. The answer inverts the intuition that fast appreciation marks where the wealth is. The top fifth of suburbs on both 2022 value and value per square metre gives 54 suburbs where property wealth is established, mostly on the Atlantic Seaboard and in the Southern Suburbs, with a mean value of ZAR 4.9 million (USD 380,000); we call these the existing-wealth list. The satellite layers read against the roll give a second list of 34 suburbs that appreciated faster than the metro as a whole with little new building and little population change, repriced without any visible physical or demographic cause; we call these the under-pressure list. Only one neighbourhood, Kalk Bay, is on both lists. The under-pressure suburbs average ZAR 1.0 million (USD 78,000) and appreciated at 3.2 percent a year, almost twice the 1.7 percent of the existing-wealth list. Yet the existing-wealth suburbs gained more every year, roughly ZAR 72,400 (USD 5,700) against ZAR 22,900 (USD 1,800), because a slower rate on a much larger base compounds to a larger sum (Figure 2 and Table 1). How much a suburb is already worth is a better guide to where wealth is accumulating than how fast its value is growing. None of this is particular to Cape Town. Any city that builds roads, runs transport and keeps schools open is producing location value, and that value is concentrated on particular neighbourhoods, not evenly across the city.
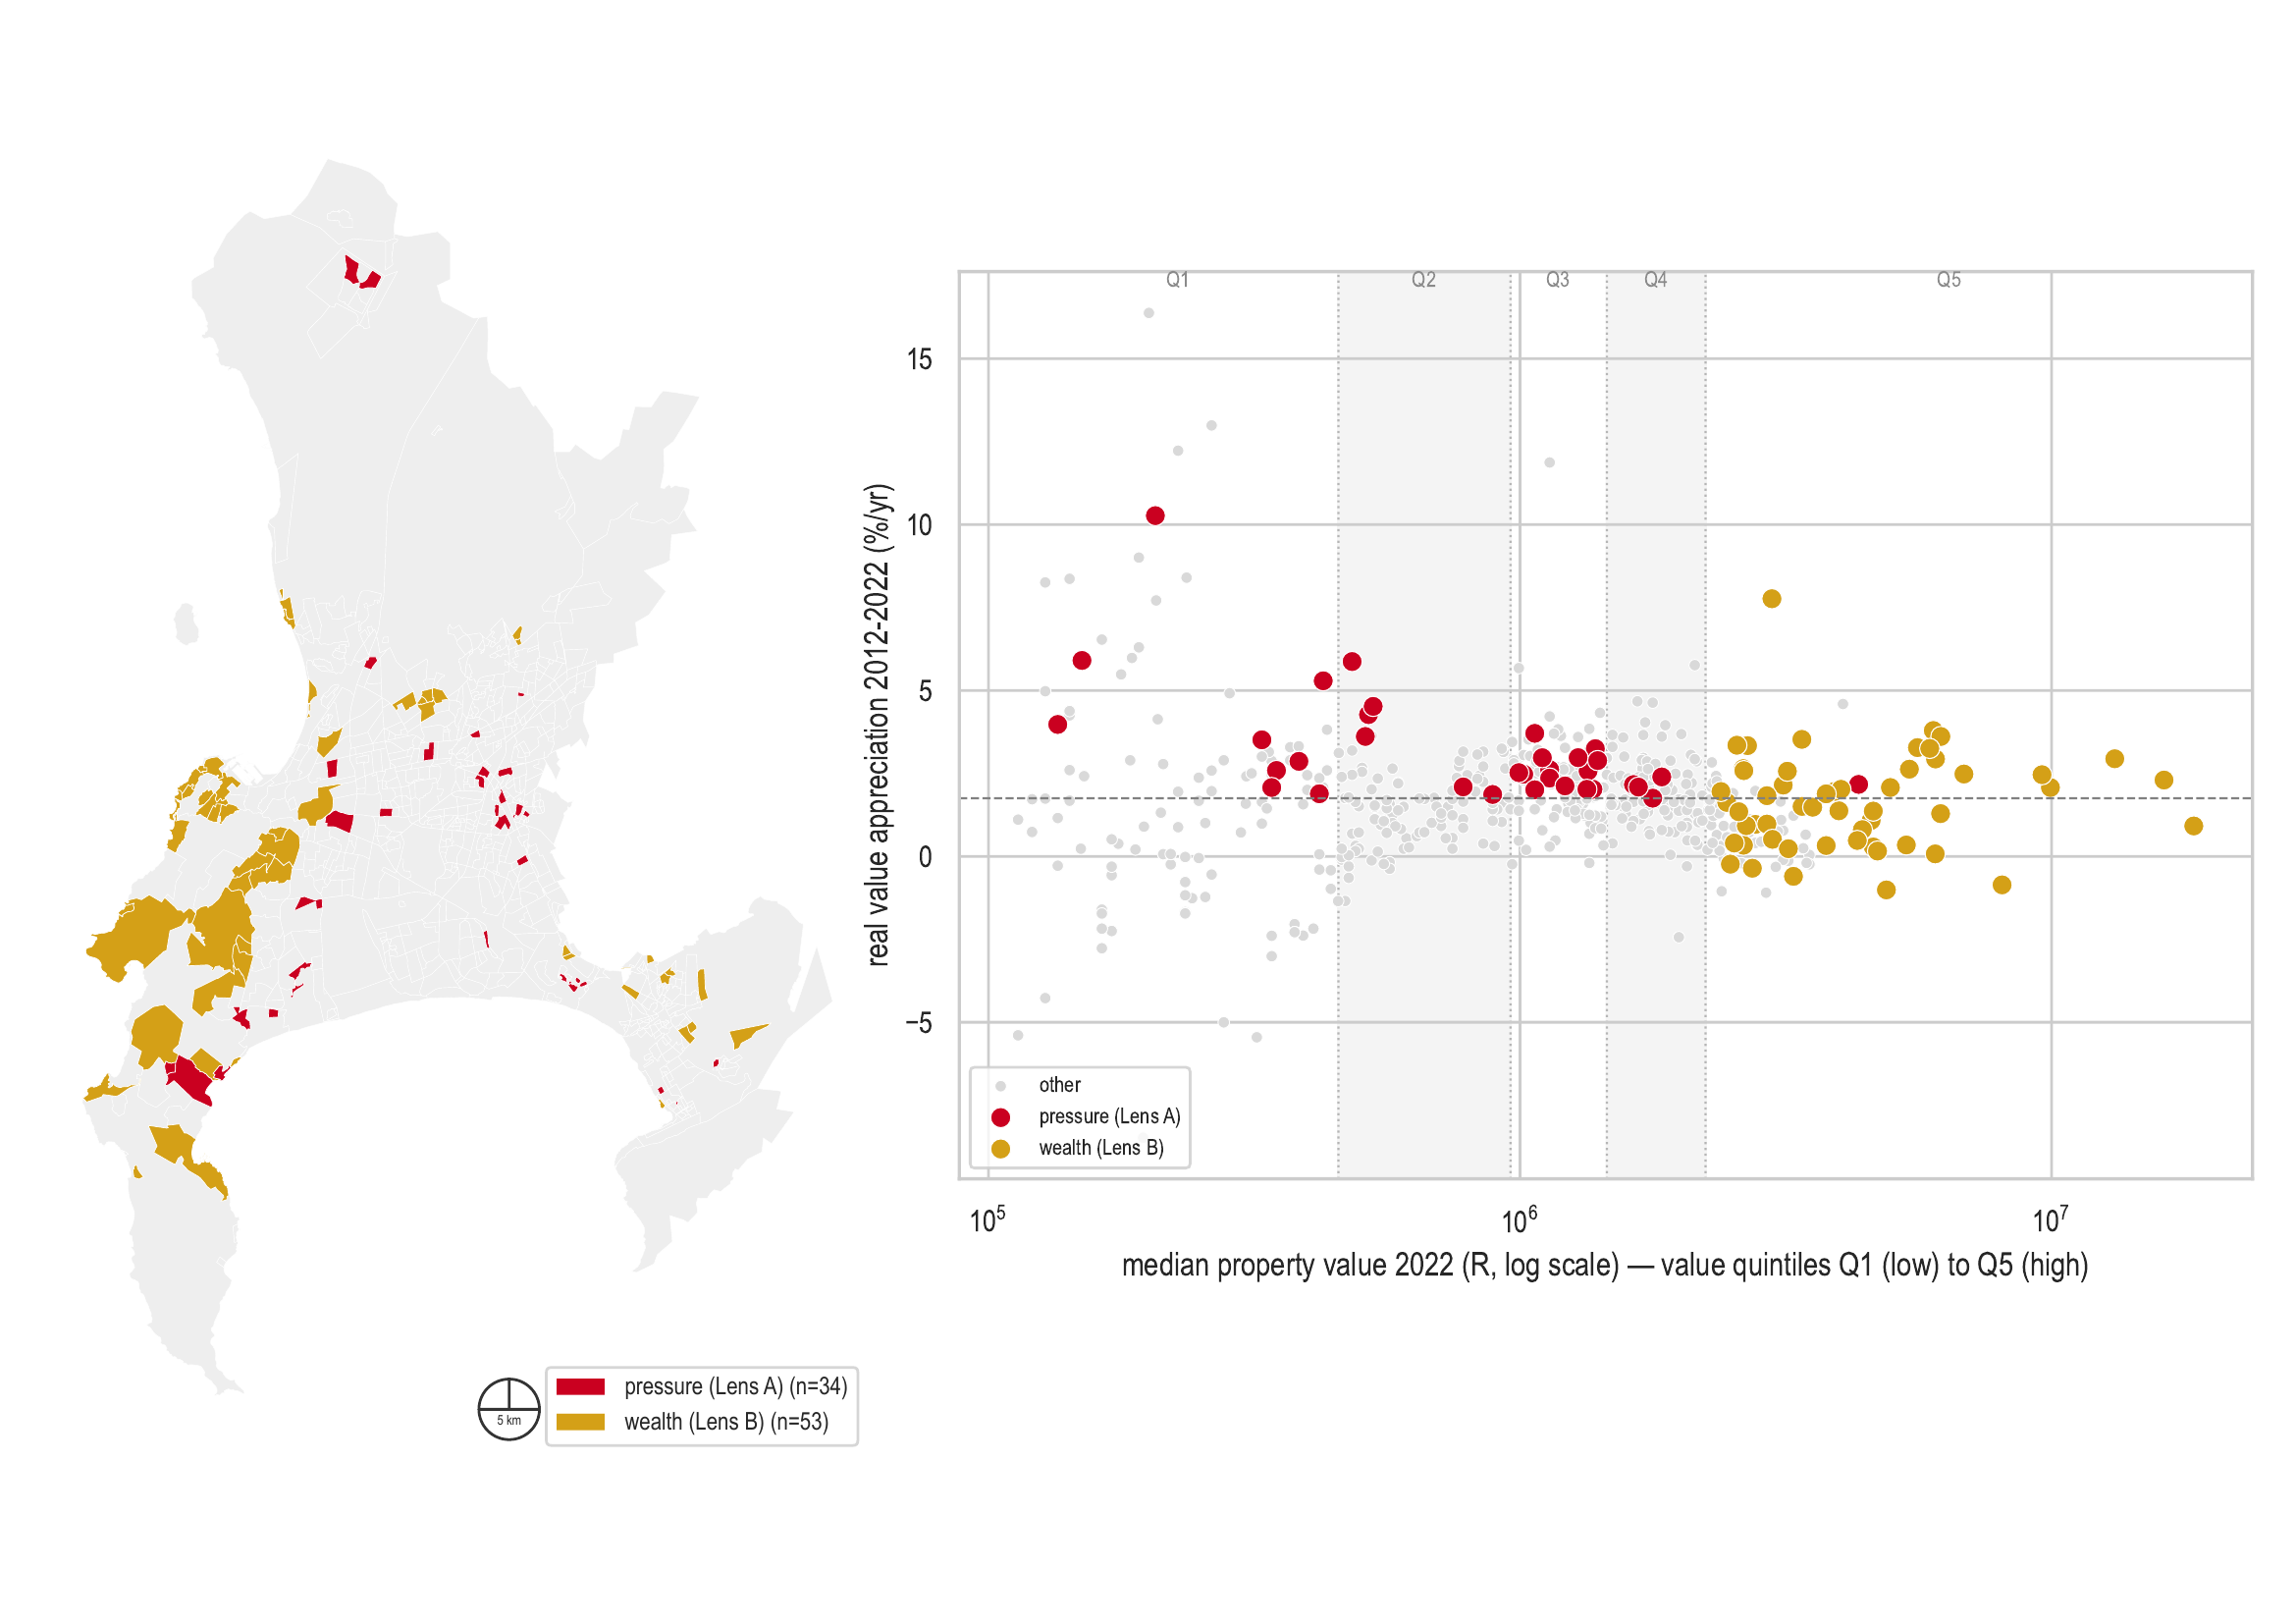
Figure 2 Cape Town’s existing-wealth suburbs (gold, labelled “wealth” in the legend) and under-pressure suburbs (red, labelled “pressure“), with each suburb’s 2022 value in rands and real appreciation compared alongside. Only Kalk Bay appears on both lists; the map colours it red, so 53 of the 54 existing-wealth suburbs appear in gold. Source: Jana (2026).
Table 1 The two lists compared. Suburbs with at least 50 dwellings (n = 566); values are real, in 2015 rands, with USD equivalents at the 2015 average rate.
| Measure | Under pressure | Existing wealth |
|---|---|---|
| Suburbs (n) | 34 | 54 |
| Mean 2022 value | ZAR 1.0 million (USD 78,000) | ZAR 4.9 million (USD 380,000) |
| Mean appreciation (%/yr) | 3.2 | 1.7 |
| Mean real gain (per year) | ZAR 22,900 (USD 1,800) | ZAR 72,400 (USD 5,700) |
| Suburbs on both lists | 1 (Kalk Bay) |
What follows for design
The general point is this: a city has a claim on the wealth that accumulated because of what it built. That wealth is not spread evenly; it sits in the neighbourhoods that public investment reached first, and their owners are now reaping it. Poorer neighbourhoods may be gaining faster today, but a neighbourhood that started on a higher base is miles ahead in what it has actually accumulated, and the public claim on it is the strongest. That is where a property-wealth levy belongs. There will be overlaps between the two geographies, and there will be individual owners who are asset-rich and cash-poor, but those are cases for exemption and deferral designed into the levy, not reasons to withhold it.
The two geographies therefore call for different treatment. Where location value has matured into held wealth, a levy can apply now. Where it is still forming on residents whose incomes have not moved with their valuations, collection can be deferred until the asset changes hands, as deferral and circuit-breaker schemes (relief that applies when the bill outruns income) have done in North America and elsewhere since the 1970s (Atria et al., 2025; Brunner et al., 2015). Deferral costs the incumbent nothing in cash while they stay, and the public collects its share when the gain is realised. Eligibility can follow tenure: a long-standing owner in a repricing suburb defers, while a recent buyer, who has just paid the full location premium, pays now.
In Cape Town, many of the under-pressure suburbs fall outside the net altogether: Vrygrond, with a median value around ZAR 206,000 (USD 16,000), sits far below the City’s rate-free threshold of roughly ZAR 620,000 (USD 49,000) and pays no rates, so the squeeze concerns a mid-value subset of the list rather than all of it. Deferral also protects owners only, and the divide between owners and tenants is itself a dimension of housing-wealth inequality (Christophers, 2021); where repricing is passed through as rent, tenants bear it and hold no asset against which to defer.
The measurement problem remains. The location component is measurable now, from assessed value and value per square metre, and a geography of matured wealth can be drawn from a valuation roll and free satellite data, which many cities already have. The structure component is harder to measure: dwelling size is a coarse proxy for private investment, and separating an owner’s improvements from the location premium property by property needs plot-level valuations, transfer dates, and building records that few cities publish. That is where the research goes next, but a tax need not wait for it, since assessed value is a measurable base already and the split refines the public claim on it. Whether a particular owner can, or should, pay a levy on that wealth is a household question rather than a suburb one. A long-tenured owner on a fixed pension may hold an asset they could never afford to buy today, while their newest neighbour has just paid the full location premium. Distinguishing the two, by tenure first and by income where the data allow, is what a deferral could be designed to do.
References
Alderman, L. (2025, September 18). ‘Tax the rich,’ French protesters cry, as the wealthy push back on paying more. The New York Times.
Alstadsæter, A., Johannesen, N., & Zucman, G. (2018). Who owns the wealth in tax havens? Macro evidence and implications for global inequality. Journal of Public Economics, 162, 89–100.
Atria, J., Contreras, D., & Méndez, M. L. (2025). Tackling wealth accumulation in a context of social upheaval: The property tax in Chile. Canadian Journal of Development Studies / Revue Canadienne d’études Du Développement, 46(2), 290–313.
Avenancio-León, C. F., & Howard, T. (2022). The assessment gap: Racial inequalities in property taxation. The Quarterly Journal of Economics, 137(3), 1383–1434.
Boll, J., Saez, E., & Zucman, G. (2026). California billionaires: Wealth, taxes, and wealth tax revenue estimates (NBER Working Paper No. 35218). National Bureau of Economic Research.
Brown, H. J. (Ed.). (1997). Land use & taxation: Applying the insights of Henry George. Lincoln Institute of Land Policy.
Brülhart, M., Gruber, J., Krapf, M., & Schmidheiny, K. (2016). Taxing wealth: Evidence from Switzerland (NBER Working Paper No. 22376). National Bureau of Economic Research.
Brunner, E. J., Ross, S. L., & Simonsen, B. K. (2015). Homeowners, renters and the political economy of property taxation. Regional Science and Urban Economics, 53, 38–49.
Causa, O., Woloszko, N., & Leite, D. (2019). Housing, wealth accumulation and wealth distribution: Evidence and stylized facts. OECD Economics Department Working Papers, 1588.
Chatterjee, A., Czajka, L., & Gethin, A. (2022). Wealth inequality in South Africa, 1993–2017. The World Bank Economic Review, 36(1), 19–36.
Christophers, B. (2021). A tale of two inequalities: Housing-wealth inequality and tenure inequality. Environment and Planning A: Economy and Space, 53(3), 573–594.
Davies, J. B., Sandström, S., Shorrocks, A., & Wolff, E. N. (2011). The level and distribution of global household wealth. The Economic Journal, 121(551), 223–254.
DIRCO. (2025, August 28). President Cyril Ramaphosa launches historic G20 experts taskforce led by Joseph Stiglitz to combat extreme wealth inequality. Department of International Relations and Cooperation, South Africa.
Garside, J. (2025, September 7). ‘People are so angry’: How wealth tax became a battleground in Norway’s election. The Guardian.
Hebous, S., Klemm, A., Michielse, G., & Osorio-Buitron, C. (2024). How to tax wealth (IMF How To Notes). International Monetary Fund.
Jana, A. (2026, July 30). A reflection on property wealth and taxes in Cape Town. SALDRU.
Levinson, A. (2021). America’s regressive wealth tax: State and local property taxes. Applied Economics Letters, 28(14), 1234–1238.
Norregaard, J. (2013). Taxing immovable property: Revenue potential and implementation challenges (IMF Working Paper No. 13/129). International Monetary Fund.
Orthofer, A., Du Plessis, S., & Reid, M. (2019). Private wealth in a developing country: Evidence from South Africa. Review of Income and Wealth, 65(3), 632–656.
Partington, R. (2024, February 29). ‘A historic step’: G20 discusses plans for global minimum tax on billionaires. The Guardian.
Pesaresi, M. (2023). GHS-BUILT-S R2023A: GHS built-up surface grid, derived from Sentinel-2 composite and Landsat, multitemporal (1975–2030) [Data set]. European Commission, Joint Research Centre.
Piketty, T. (2014). Capital in the twenty-first century (A. Goldhammer, Trans.). Harvard University Press.
Saez, E. (2017). Income and wealth inequality: Evidence and policy implications. Contemporary Economic Policy, 35(1), 7–25.
Scheuer, F., & Slemrod, J. (2020). Taxing our wealth. University of Zurich and University of Michigan.
Stiglitz, J. E., Abdenur, A., Byanyima, W., Ghosh, J., Valodia, I., & Zembe-Mkabile, W. (2025). Report of the G20 Extraordinary Committee of Independent Experts on Global Inequality. G20.
Walt, V. (2025, September 15). The wealth tax plans that are roiling New York and Paris. The New York Times.
Wenzer, K. C. (Ed.). (2016). Land-value taxation. Routledge.
Zucman, G. (2019). Global wealth inequality. Annual Review of Economics, 11, 109–138.
Zucman, G. (2024, May 3). It’s time to tax the billionaires. The New York Times.
-
Values are in 2015 rands (ZAR), converted to US dollars (USD) at the 2015 average rate of ZAR 12.76 per USD. ↩